We're On A Throw To Nowhere
What did we learn from Thomas Grønnemark, throw-in guru, and how can it be applied to the recent derby?
I hope you enjoyed our interview with throw-in expert Thomas Grønnemark.
The football landscape in Europe is becoming increasingly polarised at all levels and therefore a progressive team should seek to maximise all marginal gains wherever they can be found that doesn’t mean spending millions on expensive footballers. A club like Celtic should sweat every margin where wages/revenues are not the constraint.
The humble throw-in is a case in point. There are an average of 43 throw-ins per Celtic match. Roughly 23 for Celtic and 20 against. That is 23 set play opportunities to plan and execute in terms of getting the ball into scoring positions. And 20 opportunities to organise to stop opponents from doing similar.
To assuage James, I’ll use an American sports analogy. The record for most first downs in an American Football match is 40. The average is nearer 20, a similar number to throw-ins. A first down is the point of maximum opportunity to progress at least 10 yards as you will get four attempts in total to achieve the minimum distance.
The amount of planning and play options associated with a first down for American football would be a thicker volume of words and pictures within a playbook FOR EACH MATCH than most Americans read in their lifetime.
Yet we appear to spend next to no time planning strategies around throw-ins.
Celtic and Bad Data
I’ve captured specific throw-in data (a count for Celtic and opponents of throw-ins taken and whether the recipient maintains possession) since the start of the 2019-20 campaign.
This is what Grønnemark referred to as “bad data”.
Taken at face value without context one might conclude Celtic are highly effective at throw-ins. In Europe, they complete 91% of thrown-in passes and that rises to 93% in domestic matches. Opponents manage 84% and 74% respectively.
Yet Grønnemark stated in our interview that Celtic were typical of most clubs in that although there were some positives – especially the speed at which throw-ins were taken – common mistakes were rife.
· throwing backwards;
· throwing to the free player not the one in the most promising attacking position;
· the “rotten banana shape” (i.e. killing space in the attacking third); and
· poor team space creation.
So, the basic data tells us little about throw-in effectiveness.
Bad Data and Bad Throw-Ins
The recent derby had A LOT of throw-ins.
The 64 total is 7th highest. Interestingly, of the six higher totals, Celtic won just one match – 4-0 at Motherwell on 19th October, 2022.
The highest ever was 76 in losing 1-2 away to Midtjylland in July 2021. Guess what? That is one of Grønnemark’s clients! They lost possession from 13 of 42 attempts. But what we learned from him was that this does not tell us if that was effective or not.
That game went to extra time of course and the highest total number of throw-ins in 90 minutes is 70 also against The Rangers in a 1-1 draw in May 2022.
In 18 matches with 60 throw-ins or more, Celtic has won only half. Five were against The Rangers and 12 of the 18 games were against teams we’d consider “awkward” – i.e. The Rangers, Heart of Midlothian. Livingston and Kilmarnock. When Celtic lost 0-1 to Ross County in February 2021, there were 60 throw-ins and Neill Lennon finally departed.
Maybe some teams have realised that forcing many throw-ins not only slows the game down, it reduces the time Celtic has on the ball with control and increases the time and scenarios you can set up your defence.
Throw-In Evaluation Framework
Grønnemark promised us a book on this subject, and he has devised a complete framework for the assessment of throw-in effectiveness including classifications and definitions; the development of strategies to improve performance; the ability to craft training programmes to deliver those improvements; a means of measuring current and future performance.
In other words, he has developed the science, art and education around throw-ins. Genius.
We can’t know the details in his head, we’ll have to wait for the book, but the interview above provided enough to make a start.
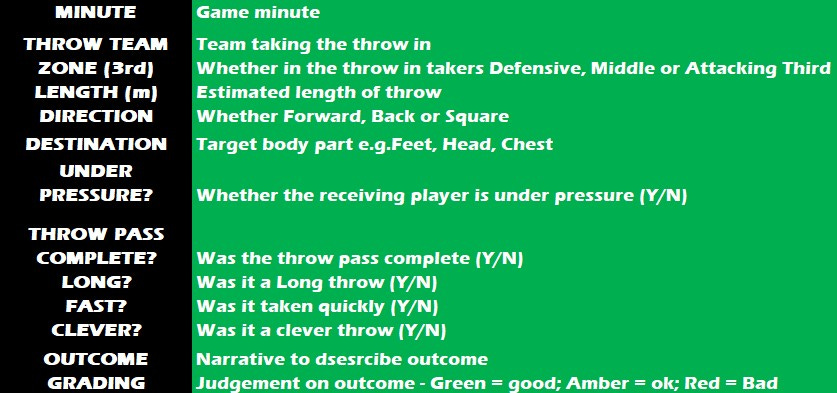
I will evaluate the throw-ins from the recent derby. Despite the performance and the result, this does provide a large sample size! There were 64 throws in total in the match.
For this exercise, I created a (*dramatic drum roll*) SPREADSHEET. Oh yes. With the following data points logged against every throw.
Let’s see what we learn from the last derby match.
Keep reading with a 7-day free trial
Subscribe to The Huddle Breakdown to keep reading this post and get 7 days of free access to the full post archives.


