


Derby Day Data
Here are the match stats from the Derby on Sunday.
Highlights

Note there are some disparities in xG based on data provider.

Statsbomb claim the most sophisticated model. I believe my own overstates The Rangers chances compared to that one due to the pressure being applied and the height of the ball for e.g. Roofe’s two central efforts in the second half. But if you are hoping for a single version of the truth for xG, forget it! Well, the correct answer is Celtic By Numbers of course!
Possession

Celtic rarely are dominated on the possession front but at half time it was 43-57%. As we will see with a lot of these stats, game state is important. “Impect Pass %” is the % of total passes that Packed at least one opponent. PEI% is the % of all actions that result in your team keeping possession.
Goal Threat

The Rangers have the best ratio of Shots Inside the Box in the league (70%). So, to limit them to only 9/14 being inside the box was ok.
Attacking Creativity
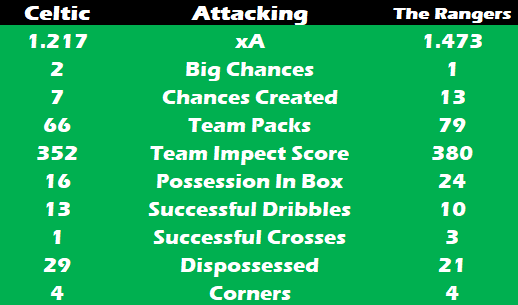
Celtic rarely get “out Packed” but again at half time, where Celtic had established their lead, it was 167-132. Possessions in the Box was 13-4 at half time. The Rangers were successful with 3 crosses out of 41 attempted.
Defending

Celtic were pretty error free after the systemic debacle in conceding the first goal. Hart made 4 saves, with a Post Shot xG of 1.21 on those saves and 1 conceded. McGregor (A) made 2 saves and 2 conceded with Post Shot xG of 1.8.
Crime Count

Once again Celtic find themselves dominating the foul count. However, on viewing it looked like Collum got most of those correct. However, however, there are four big calls under review by the Yorkshire Whistler:
40
Maeda goes down in box under challenge from McGregor
61 Jack cross blocked by Carter-Vickers 64 Giakoumakis fouls Jack and Jack places his hand over Giakoumakis face 78 Goldson goes down under challenge from Carter-Vickers from corner
Hope you have enjoyed the stats fest. I’ll write more about the players over the next few days.