

With the major European league transfer window having slammed shut on February 3rd, I thought it a good time to revisit the benchmarking exercise I have conducted to analyze Celtic’s player trading model.
The universe of benchmark clubs I have assembled was discretionary, and those I believe offer a reasonable range of clubs that represent peers within a European context. Note, I have excluded the major non-Big 5 league clubs such as Porto, Benfica, and Ajax, from this exercise, as they were so far ahead of the rest of the group as to skew things.
Ideally, Celtic would be among those elite clubs, but I am not pretending that the club has the strategic advantage of decades of tapping the best Brazilian talent, or the player development history of Ajax.
Another aspect of this analysis is to draw a distinction between the pre-analytics period and the post-analytics period. I draw the line at the start of the 2016-2017 season. This is my qualitative assessment of a reasonable fault line between the two eras, as the use of data and analytics really began to grow rapidly around that time, from what I have been able to estimate.
One other caveat - some of the clubs included have transfer windows that remain open, so have not technically concluded their 2024-2025 equivalent ‘season’ quite yet.
With those housekeeping issues out of the way, let us get to the myriad of graphics, starting with total player trading profits beginning with the summer 2016-2017 window:

I have highlighted Celtic in green throughout the graphics. These are ‘profits’ calculated using the data on Transfermkt and netting out the amounts listed for arrivals and departures by season. As I always say, in analytics we are interested in accuracy rather than precision, so the data source is notably not forensically accurate. In addition, these ‘profits’ are not the same as those reported by clubs via their financial statements, as those are accounting profits using accrual accounting methodologies that differ from the simple exercise I have conducted.
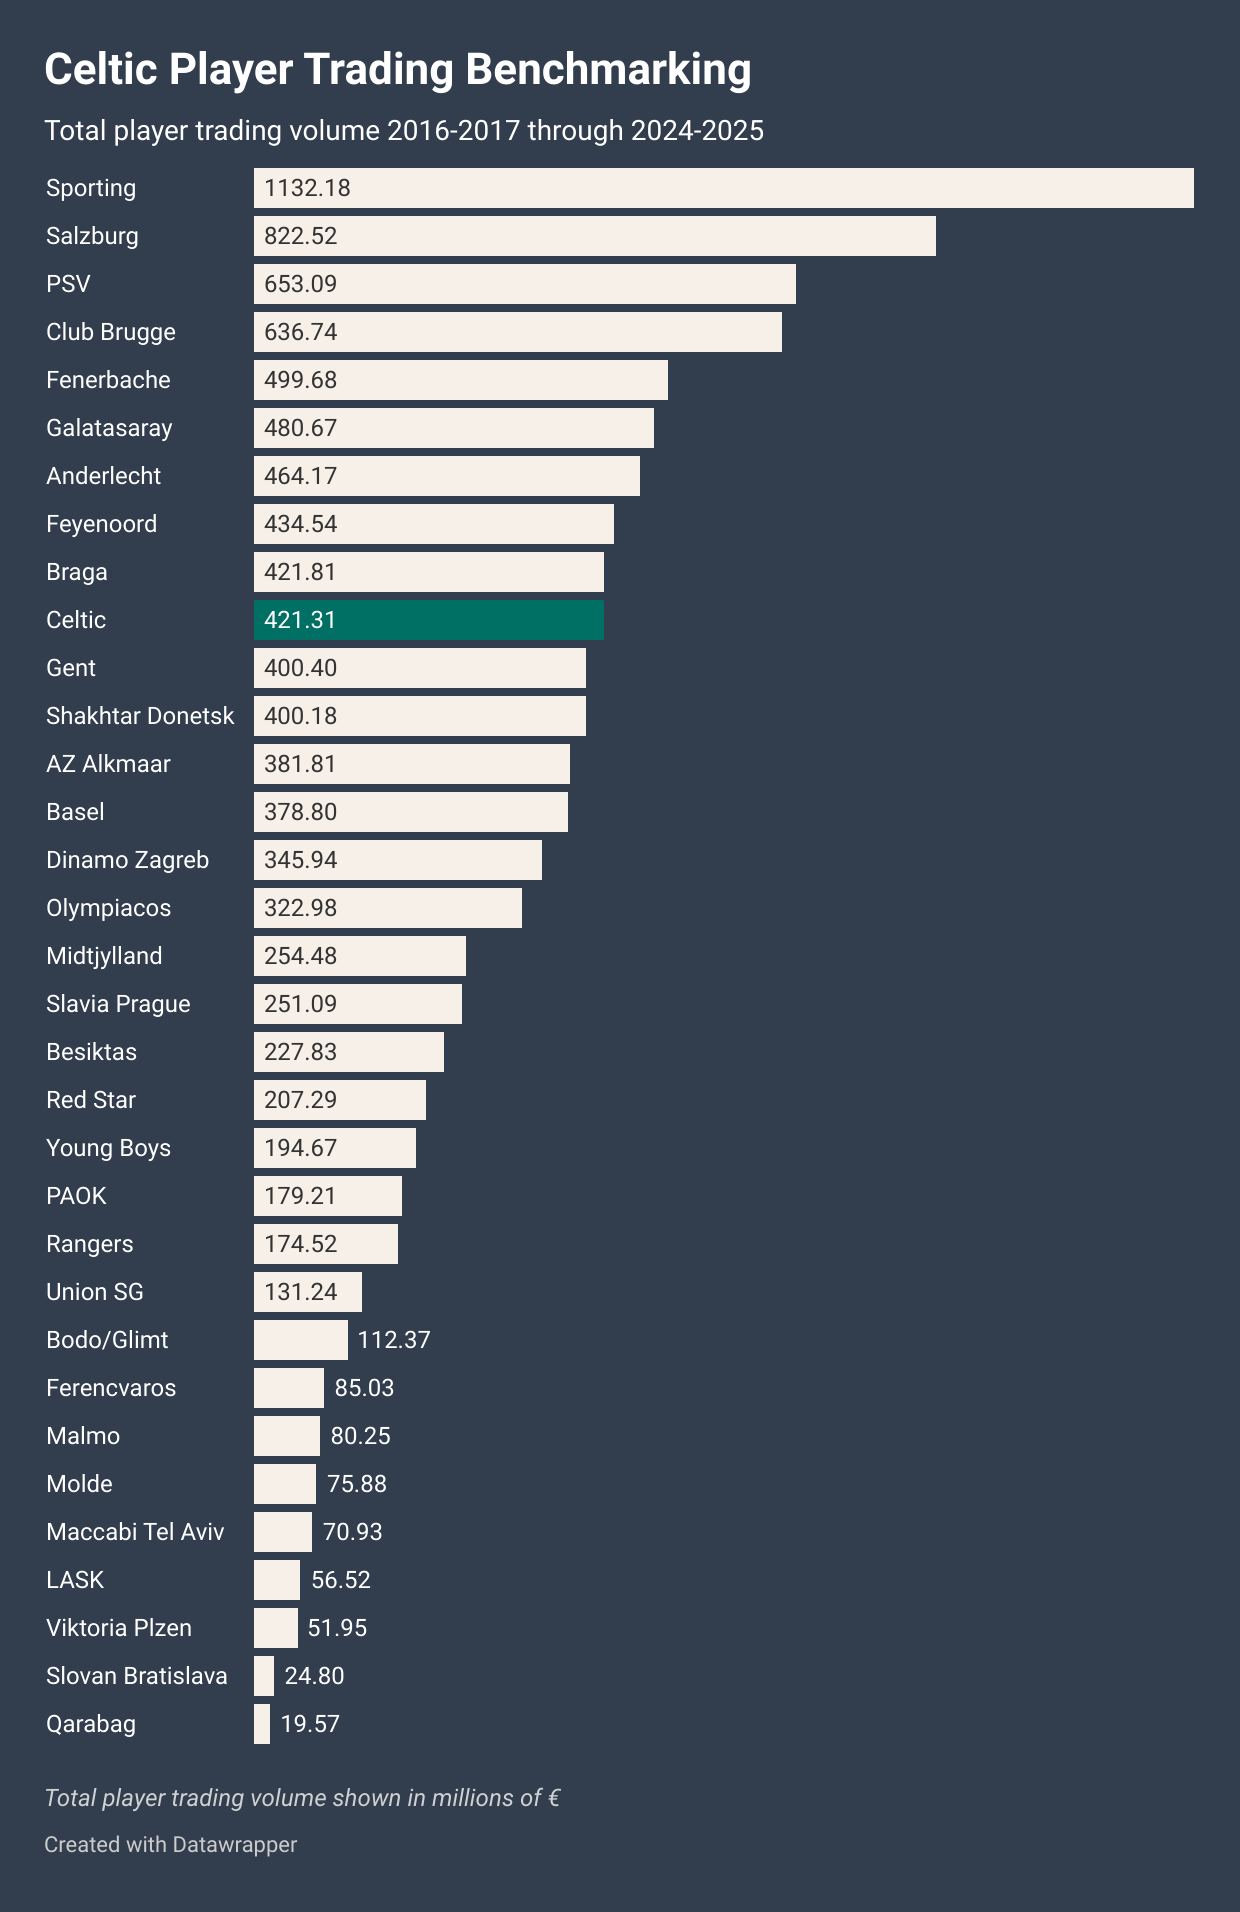
This next graphic showed the total amount of player trading volume, both arrivals and departures, in hundreds of millions of euros. While profits for Celtic benchmarked relatively low in this peer group, total trading volume aligned more with what many people probably consider the ‘bigger clubs’ within the group.

The next graphic showed the simple calculation dividing profits by the total player trading volume, in what I called a ‘profit margin’ in this exercise. Again, this is NOT the same as profit margin calculations within the financial statements of clubs. This was calculated for the entire period, starting with the summer 2016-2017 window.
We saw here the manifestation of Celtic’s relatively low profits and higher total volumes via the lowest positive margin.

This graphic shows the change in profit margin levels from the period starting with the summer 2012-2013 window through winter 2015-2016 versus the subsequent period. Why this comparison?
Context was vitally important for this graphic. For example, a club like Bodo/Glimt engaged in virtually no player trading from 2012-2013 through 2015-2016, and what little they did (less than €1 million total) was all player sales. That produced a ‘profit margin’ of 100% in that prior period, with Union SG and LASK similar - very low trading and only sales during the prior period. Therefore, the 59.49% decline in Bodo/Glimt’s profit margin shown in the graphic above was materially different than that of a club like Shakhtar Donetsk, whom had the highest turnover of the peer group in the prior period, at almost €320 million vs just Bodo/Glimt.

Shakhtar Donetsk were another example of context being important - numbers/data without critical thinking are not of much use! Obviously, that club’s situation since the start of the war in February 2022 needs to be considered when analyzing its player trading.
Ideally, a well run business is able to maintain high absolute profit margins as revenues grow, with more mature operations also reasonably benchmarked to their own relative levels. Celtic’s fits the latter description, IMO, as player trading was not ‘new’ and was material during the prior period.
Important context that was Celtic-specific which informed this exercise was my selection of the 2012-2013 as the start of the prior period - the first season after Rangers’ liquidation.

This image is a new version replacing the original that included errors (via column sorting), thankfully pointed out by an eagle-eyed reader. Celtic was correct in both versions.
This grahic showed the seating capacity for the stadiums of each club as listed on Transfermkt. I used this information to calculate something I called:
Board to Supporters Ratio:
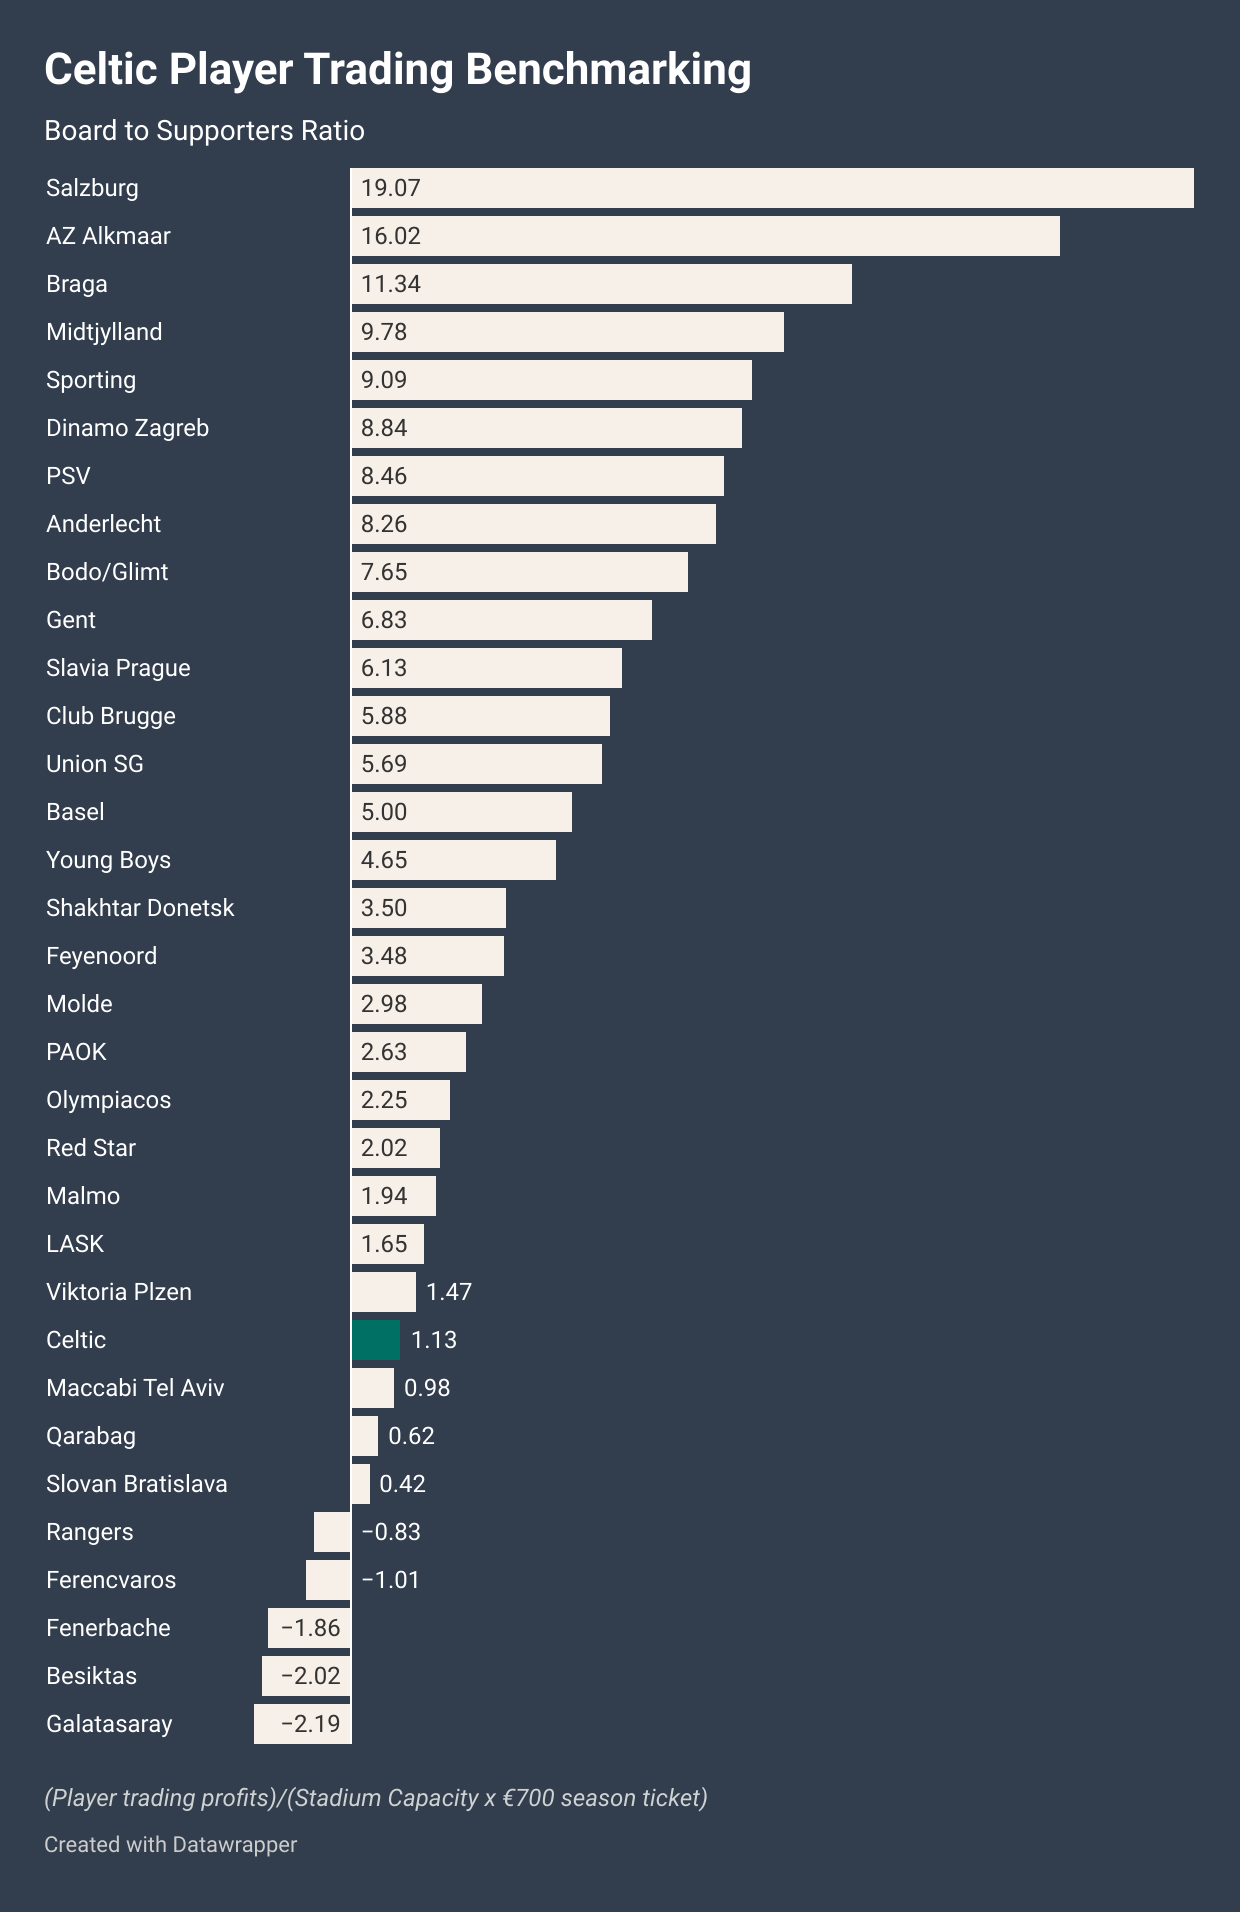
I listed the inputs to the ratio at the bottom of the graphic - again, this is an exercise. The amount of trading profits since 2016-2017 for Celtic has amounted to roughly one season’s estimated ticket revenues via the €700 assumption…this is NOT precise but intended to be directionally accurate.
Analytical Conclusions
If I took a charitable approach to this exercise, then I would assume that the people running Celtic are victims of reference dependence - i.e. their reference point in measuring the club’s player trading model has been domestic competitors, with Rangers the obvious focal point.
Here were comparable metrics if one were to benchmark versus the domestic ‘big clubs’ since the 2016-2017 season:

This further highlighted how poorly Rangers and Hearts have been run, in particular, and perhaps a framing on why Tony Bloom has targeted Hearts. Aberdeen have made material strides but only to ascend from absurdly poor to a bit functional.
For Celtic, a more robust benchmarking of the club’s performance remains pervasively poor. Well run player trading models have been able to extract massive profits from the high industry inflation of the last decade. Celtic’s total trading has inflated along with the industry, up from an average of €26.5 million per season for the four seasons beginning with 2012-2013 to €67 over the last four seasons.
What this exercise makes clear, in my opinion, is that the relative incompetence of how Rangers have been managed, within a league that is still largely bereft of player trading, has been laundered into vastly overstating the quality of how Celtic’s player trading has been managed.
If Rangers were to simply go from a trainwreck to modestly below the peer group average, they would be able mostly close the structural financial gap Celtic enjoy from having the larger stadium capacity and commercial revenues.
In addition, Union Saint Gilloise (USG), a Bloom-controlled club in the peer group above, have had over €126 million of player trading volume since their return to the Belgian top flight for the 2021-2022 season, with aggregate profits of over €38 million. While media rights are a bit more than double Scotland’s, they also have approximately 40% the seating capacity of Hearts.
USG have had the top points total in their league prior to the playoff split (very different to Scotland’s split) in their first three seasons in the Pro League, far out performing Anderlecht, who spend roughly five times the amount of USG’s wage bill.
Hearts currently spend about 20% of Celtic’s wage bill, and that would be BEFORE any hypothetical boost to player trading analogous to USG. If Hearts were to replicate and allocate the incremental gains to player wages, they could reach roughly 40-50% of Celtic’s level.
Now, I am not predicting any of this to occur - only highlighting that the Celtic board, despite the club being in a position of financial dominance, leave it potentially vulnerable.
We have seen in leagues like the Belgian relatively poorly run football operations, like Anderlecht, have been eclipsed by the likes of Club Brugge (roughly 70% of Andelrecht’s wage bill), and even a relative minnow like USG.
Even a financially diminished Rangers and/or a Bloom-backed Hearts would likely present greater relative financial threats to Celtic.
The longer the board persist with an archaic operating model, the greater the risks of the endowed resource advantage being squandered.
Great work James! This would appear to confirm the view that we have been measuring our relative success vs domestic competition - ie setting an incomplete set of KPIs that has undermined success in Europe.
Ah ok, makes sense thank you.
I think I thought the disparity would be higher, particularly some of the scandinavian leagues which I believe sell all of their games so get similar or less £/game but much higher overall revenue.
I'm not 100% sure on any of this detail though, as you can tell!