

The recent Glasgow Derby was a perfect example of how twisted narratives become within the context of this fixture. All the post-game agenda setting by press and The Rangers alike was of injustice at the result because of the referee. Specifically, an alleged foul on Jack in the lead up to the winning goal.
As I showed in Willie Wonky, not only was the referee likely correct in that instance (as Dermott Gallagher opined on Sky Sports’ regular review of decisions) but the balance of incorrect refereeing decisions in the game was overwhelmingly detrimental to Celtic. The complete opposite of the narrative that was pursued post-match.
It got me thinking of how to apply a more statistical based analysis of refereeing performance. Clearly it will never be perfect. It is difficult to count non-decisions for example. And a lot of decision making is subjective in a fast moving, contact-based, fluid sport. But if we look over a large enough sample surely trends will emerge?
One aspect of Sunday’s game that struck me with my partisan head on, as it does in many Celtic games, was the number of really soft fouls awarded against Celtic in the second half. Not enough to warrant even talking’s to never mind cards, but enough to break up the game, disrupt attacking momentum, or invite opposition pressure. Fouls are also very common as game event.
1380 fouls were awarded in all Celtic matches last season – 22.6 per match. Fouls are, after Passes, Clearances and Challenges, the 4th most prevalent in game action! I was surprised too! That means there should be some meaningful data to examine.
Traditional footy analysis would say Celtic (2017/18) have been awarded 782 fouls and their opponents 598. If anything, Celtic get preferential treatment from referees. Case closed. Move on.
Possession Adjusted Foul Count
But regular readers will know that is not a very scientific analysis.
Celtic, especially in Scotland, dominate possession to an unparalleled degree in Europe. Last season Celtic had 68% of possession in domestic football. Not even Barcelona or Guardiola’s Manchester City managed that (more of them later). Generally, the team with the ball does not commit fouls. Clearly, they do. But for the sake of this analysis let’s assume across the board that the team without the ball commits the fouls.
Also, I am not accounting for actual ball in play minutes. I haven’t got the time to calculate that! So, we’ll assume the ball is in play for 90 minutes. Over a large sample this should not matter.
Once we accept those limitations, we can simply adjust the foul count to account for possession.
For example, if we take Sunday’s match:
Celtic had 60% possession
Celtic committed 15 fouls
The Rangers had 40% possession
The Rangers committed 17 fouls
Celtic’s Possession Adjusted Foul Count =
Number of Minutes (90) x Possession % of the opponent (40%) = 36mins without the ball
Divided by the number of fouls conceded (15)
36/15 = 2.4 minutes without the ball between each foul conceded
Using the same method for The Rangers:
(90x60%) / 17 = 3.18 minutes without the ball between each foul conceded
In this example Celtic were being penalised with a foul more frequently than The Rangers when out of possession
The lower the number, the more often your team is being penalised – i.e. less minutes between each foul conceded.
One match is obviously too small a sample to see trends but I hope this illustrates the method.
Interestingly the Daily Record (I know!) almost stumbled upon a very similar analysis when they did an article on Craig Levein’s dog whistle to clamp down on Brown (who happens to be significantly more fouled than fouls he commits). You can read the article here. They mention foul count AND possession but can’t quite join the dots. But applause for effort.
European League Champions Foul Analysis
In terms of data available for free, Scottish football is very poorly served as you might imagine. I could not source even basic possession and foul data for SPFL matches other than if I trawled through BBC Sport reports (does it look like I have too much time on my hands?).
But thankfully similar data (and a lot more) is available for many “major” European leagues on Who Scored. It’s a useful resource, I recommend it.
Given Celtic are the Champions, I took the possession, fouls and fouled data for all the top leagues’ Champions for the same years as I have data for Celtic (2014/15 – 2017/18 completed seasons).
I then calculated Possession Adjusted Foul Count for each of those teams across the leagues there was data for on Who Scored.
Here is the raw data by year and country for the Champions across all those seasons:

Now let’s apply the Possession Adjustment to the Foul Counts and reorder by the difference between Minutes Between Fouls Committed and Minutes Between being Fouled.

Champions seem to be more harshly treated by referees – only four Champions had a positive difference between Minutes Per Foul and Minutes Per Fouled – i.e. they were awarded fouls more often than they fouled. I am not sure why this might be – perhaps champion teams are more aggressive?
Bayern Munich consistently get awarded fouls against them more often that their opponents.
But what about Celtic? The average difference is -1.16 and Celtic, in the four seasons I have data for, consistently and significantly, are penalised more often that their opponents. Celtic occupy 4 of the bottom 11 places in this table.
A Question of Style
Let me show you the table again and tell me why I have highlighted the teams in red?
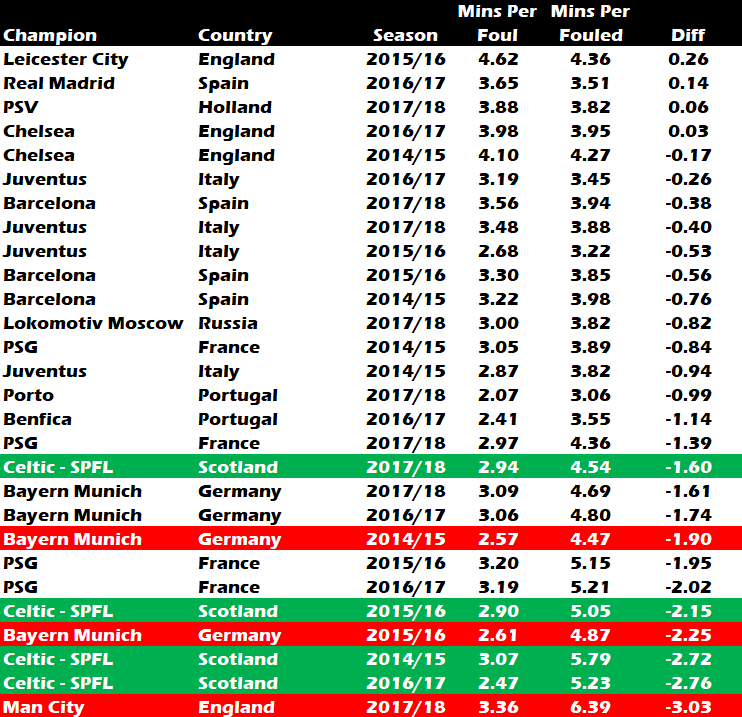
The teams in Red are those Champions managed by Pep Guardiola. Why is that significant? In December 2017 The Telegraph reported on the latest mutterings from one J. Mourinho prior to a key Manchester Derby. You can read the article here.
Essentially, the bould Jose was indulging in some mind games around a claim that Manchester City were a team that indulged in a lot of “tactical fouling”. Manchester City like to keep possession, and they like to pile players forward. Losing the ball opens them up to counter attacking and being out numbered. They therefore foul rather than defend the counter.
The Mourinho antics have long since lost the power to enthral but the Football365 website took up the challenge. Using similar methodology to that which I have employed here, they concluded that despite being ranked 20th (last) in terms of fouls conceded, Manchester City ranked 1st in number of fouls conceded per minute out of possession. You can read the article here.
It looks like Jose had a point. And my data above would back the scallywag up (don’t tell him). Manchester City from last season had the highest differential between minutes per foul awarded versus conceded. His 2015/16 Bayern Munich side splits Celtic’s seasons above that the Bavarians 2014/15 season not far ahead of that.
So, Guardiola sides foul by design. There is no conspiracy or bias at play.
Surely, then, as Celtic side play a similar style – high pressing possession-based football it is a question of approach? The table above is as much about style and strategy as refereeing?
Now I wouldn’t agree with that as, to my green eye, Celtic don’t particularly foul a lot and lack cynical players. But I would say that, wouldn’t I?So, let us consider something more objective.
If it was truly a question of style, and all refereeing was equal, then Celtic would be treated exactly the same in all their matches, right? If Celtic were indulging in tactical fouling to mitigate a high pressing, over committed attacking strategy, then that would be evident if we looked at their matches outside of Scotland? After all, one of the biggest criticisms I have of Rodgers is he has not tempered his style for European opposition resulting in a few embarrassing thumping’s.
Therefore, European referees would treat Celtic the same as Scottish ones.
Let’s take a look.
Celtic In Europe vs Celtic In SPFL
Using the same methodology, the difference between the European campaigns and SPFL campaigns in terms of raw data is:
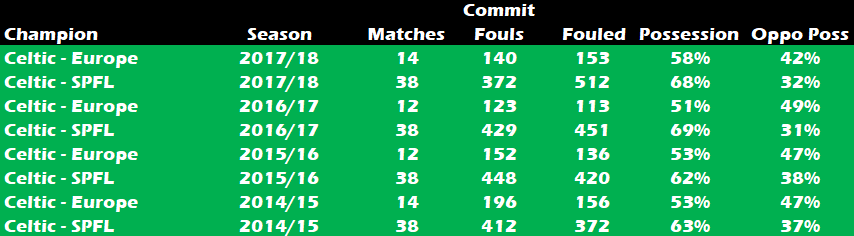
Applying the Possession Adjusted Foul Count method those campaigns ranks as follows:

All four Celtic European campaigns have seen Celtic awarded fouls against less frequently than in the SPFL over the same seasons.
And it isn’t even close.
Celtic average -0.92 for European matches. They concede a foul every 3.61 minutes but are awarded a foul on average every 4.54 minutes. Remember this is against teams from Linfield to Barcelona. The full spectrum of European opposition and rankings over 52 matches.
In the SPF Celtic concede a foul every 2.85 minutes but are only awarded a foul every 5.15 minutes accounting for possession.
Conclusion
I’ve considered four seasons worth of data across a number of European leagues. I have compared Celtic in Europe (52 matches) to Celtic at home (152 SPFL matches) as regards the frequency of fouls awarded for and against considering possession.
Whilst there may be some deliberate strategies at play, especially amongst Guardiola managed teams, the differential between Celtic’s home and European treatment is difficult to explain based on team style.
Celtic appear to be refereed differently in Scotland. An analysis of all Scottish teams using the same methodology would be welcome.